


Skip to content

Help people discover your local food scene.

Dining stories and event campaigns that spotlight your city, neighbourhood and local businesses.

What campaigns like yours delivered

883 clicks to the festival site for Bite of Burnaby 2026. 2,308 giveaway entries for Crave the Heights 2025.

Tourism boards, DMOs and BIAs who build with us

  • Tourism Burnaby
  • Tourism Richmond
  • Crave the Heights

Case file · Tourism Burnaby, Bite of Burnaby 2026

Bite of Burnaby: a month of local dining discoveries.

The campaign

Get residents and visitors exploring Burnaby’s food scene during the month-long Bite of Burnaby Festival, March 1 to 31.

What they got

  • 4 Bite of Burnaby feature articles, one per neighbourhood
  • 2 Instagram Reels, reposted to TikTok
  • A giveaway
  • Dedicated weekly newsletter mentions
  • Events Calendar listing and Instagram Story shares

What happened

The campaign recorded 883 tracked clicks to biteofburnaby.ca.

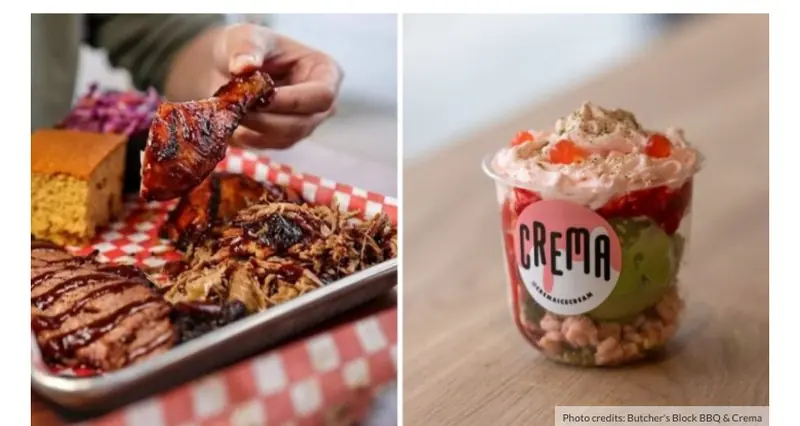
One of the four neighbourhood articles, March 1, 2026

Festival site clicks
883
Campaign views
112K
Newsletter impressions
33,822

Case file · Crave the Heights 2025, Heights Merchants Association

Crave the Heights: a neighbourhood dining campaign.

The campaign

In the Heights Merchants Association’s own words: awareness across Burnaby and Metro Vancouver for a 10-day dining event across the neighbourhood’s restaurants.

What they got

Article, dedicated newsletter feature, giveaway Reel, five Story frames and two Facebook posts.

What happened

The giveaway recorded 2,308 entries. Its Reel reached 47,086 accounts.

Also: Tourism Richmond

Tourism Richmond, Ice Cream Festival 2026: 6 Richmond vendors carrying 15 of the 123 festival items, over 200 pieces of content and 1,268,812 impressions. Platform-reported.

The web article, September 9, 2025

Giveaway entries
2,308
Giveaway Reel views
64,248
Accounts reached
47,086

Who reads Noms Magazine

Metro Vancouver locals in their spending years.

Audience insights · 2026

Where they live Share of audience

Vancouver 50%
Burnaby 18%
Richmond 15%
Surrey 11%
Coquitlam 6%

Age

76% Aged 25 to 44

65% Household income $75K+

66.5% Women

  • 63,900Instagram followers
  • 7,162Newsletter subscribers · about 4,200 open every issue
  • 100KWebsite visits a month
  • 9MViews and impressions a month, across all platforms

Audience insights, 2026. City shares show where the audience lives across Metro Vancouver. Newsletter figure from Beehiiv, October 2026; other channel figures verified July 2026. The 9M is platform-reported views and impressions across Facebook, Instagram, Google Search and TikTok in a recent month, not deduplicated; one campaign reaches a slice of it.

Ready to reach Metro Vancouver’s food lovers?

Work with us (opens the form in a new tab)